Introduction

Modern enterprise environments are more connected, distributed, and performance-sensitive than ever before.

Cloud applications, hybrid work, unified communications, remote users, SaaS platforms, encrypted traffic, and distributed networks have fundamentally changed how organizations operate. At the same time, IT teams are under increasing pressure to reduce downtime, improve user experience, accelerate troubleshooting, and support future AIOps initiatives without adding more complexity.

Most organizations already have strong monitoring coverage. Metrics, Events, Logs, Telemetry (MELT), and Flow data provide important operational insight. Traditional network monitoring systems and network performance monitoring tools can identify symptoms quickly.

But when teams need to know exactly what happened and why, those tools often only tell part of the story.

This is the root cause gap.

IT teams can see alerts, latency spikes, retransmissions, degraded application performance, or poor voice quality, but they still struggle to pinpoint where the problem actually started.

Was it the client?
The network?
The WAN?
The cloud provider?
The application server?
A misconfigured device?
Encrypted traffic?
An intermittent issue nobody caught in real time?

Without packet-level visibility, troubleshooting becomes slow, fragmented, and reactive.

Teams waste valuable time jumping between dashboards, escalating incidents across operational silos, and debating ownership instead of solving the problem.

This is why real time packet-based observability is becoming increasingly important for modern enterprise operations.

Teneo’s Network Performance Monitoring & Diagnostics (NPMD) solution helps organizations move beyond alerts and assumptions through packet capture, packet analysis, historical packet analysis, and real-time packet analysis.

Instead of relying only on summarized telemetry, Network Performance Monitoring & Diagnostics (NPMD)  analyzes the actual traffic moving across the environment, giving IT teams the operational evidence needed to accelerate root cause analysis and resolve issues faster.

This guide explores:

  • Why traditional monitoring still leaves operational blind spots
  • The hidden operational cost of slow root cause analysis
  • Why packet-based visibility changes troubleshooting
  • What makes modern packet analysis different
  • How organizations are using packet analytics to reduce downtime and improve operational resilience
  • Why speed, simplicity, and cost efficiency matter in modern network performance monitoring

The Modern Troubleshooting Problem

Troubleshooting enterprise environments has become significantly harder over the last several years.

Modern digital services now depend on a complex ecosystem that spans:

  • Public cloud platforms
  • SaaS applications and services
  • Hybrid cloud environments
  • Enterprise data centers
  • SD-WAN architectures
  • Unified communications platforms
  • Remote and hybrid workforces
  • Third-party services and API

At the same time, IT teams are expected to troubleshoot issues faster than ever before.

The challenge is not a lack of monitoring data.

The challenge is that operational data is fragmented across too many tools.

Organizations may already have:

  • Network performance monitoring (NPM) devices
  • Cloud based network monitoring tools
  • Digital experience monitoring (DEM) tools
  • SIEM platforms
  • Application performance monitoring (APM) systems
  • Flow collectors and analyzers
  • Infrastructure monitoring platforms
  • Log management solutions

Each tool provides part of the picture.

Very few provide the actual evidence needed to reconstruct exactly what happened across the network.

This creates major operational challenges:

  • Slow troubleshooting workflows
  • Escalation fatigue
  • Longer mean time to resolution (MTTR)
  • Finger-pointing between teams
  • Difficulty validating root cause
  • Intermittent issues that disappear before investigation begins
  • Poor visibility into encrypted or distributed traffic
  • Incomplete understanding of user experience

As environments become more complex, the operational cost of incomplete visibility continues to grow.

Why Traditional Monitoring Still Leaves Gaps

Traditional monitoring platforms are extremely valuable.

Metrics, logs, and flow data provide important operational visibility into:

  • Device health
  • CPU utilization
  • Interface statistics
  • Traffic volumes
  • Infrastructure status
  • System events

But these technologies are primarily designed to show indicators and symptoms.

They often struggle to answer deeper troubleshooting questions such as:

  • Why is Microsoft Teams quality degrading?
  • Where is packet loss occurring?
  • Why are only some users impacted?
  • What changed before the issue started?
  • Which hop introduced latency?
  • Is the issue application-related or network-related?
  • What exactly happened during the outage?
  • Why is cloud application performance inconsistent?

Metrics summarize behavior.

Packets reveal behavior.

Packet analysis provides access to the actual network conversations happening across the environment, allowing teams to inspect communication patterns, retransmissions, connection timing, application behavior, and protocol activity with much greater precision.

This is why packet-based observability and AIOps is becoming such an important operational capability for modern IT teams.

The Hidden Cost of Slow Root Cause Analysis

Slow root cause analysis creates much bigger problems than most organizations realize.

The issue is not only downtime.

The issue is operational inefficiency.

When teams cannot quickly isolate root cause, organizations experience:

  • Longer outages
  • Increased operational overhead
  • More escalations
  • Slower remediation
  • Reduced productivity
  • Poorer user experience
  • Delayed incident response
  • Increased operational stress
  • Reduced confidence in monitoring systems

Many IT teams spend hours moving between dashboards and operational teams trying to determine whether the issue originated with:

  • The network
  • The cloud provider
  • The endpoint
  • The application
  • Unified communications infrastructure
  • Wi-Fi environments
  • Security tooling
  • WAN connectivity

Without packet-level evidence, troubleshooting often becomes a process of elimination instead of direct validation.

This dramatically increases MTTR and slows operational response.

Why Packet-Based Visibility Changes Troubleshooting

Packet-based visibility changes troubleshooting because packets provide evidence instead of assumptions.

Packets are the fundamental units of network communication. Every application request, response, voice call, video session, cloud transaction, and network conversation ultimately moves across the environment as packets.

Packet capture and packet analysis allow IT teams to inspect those communications directly.

This gives organizations:

  • Packet-level visibility
  • Full packet capture
  • Historical packet analysis
  • Deep packet inspection
  • Packet replay
  • Network traffic analysis
  • Packet analytics
  • Real-time packet analysis
  • Packet forensics capabilities

Instead of trying to infer what happened from summarized telemetry, teams can analyze exactly how applications, devices, users, and services interacted across the environment.

This dramatically improves:

  • Root cause analysis
  • Network troubleshooting
  • VoIP troubleshooting
  • Application visibility
  • Security investigations
  • Cloud troubleshooting
  • Operational confidence

With the actual packet-level evidence in hand, teams can resolve issues faster and eliminate the back-and-forth over whether the problem originated with the client, the network, the cloud, or the application itself.

What Makes Modern Packet Analysis Different

Traditional packet capture solutions have historically been associated with:

  • Complexity
  • Expensive hardware
  • Slow workflows
  • Difficult deployments
  • Manual extraction processes
  • Operational overhead
  • Limited visibility due to DC only deployments
  • Difficult to download packet traces due to size
  • Inability to see packets near the user

Modern packet analysis tools are changing that.

Today’s leading network analyzer platforms are designed to provide:

  • Faster search
  • Faster packet extraction
  • Historical packet analysis
  • Packet replay
  • Distributed visibility
  • Cloud based network monitoring
  • Simplified deployment
  • AI-assisted troubleshooting
  • Lower operational complexity
  • Synchronization of packets across the network

This is where Teneo’s NPMD solution, powered by Allegro Packets, is uniquely differentiated.

Speed Changes Everything

During a major outage or operational incident, speed matters.

Many traditional packet analysis tools struggle when teams need to rapidly search and analyze large traffic datasets.

Modern packet-based observability platforms built on high-speed in-memory architecture can dramatically reduce the time required to:

  • Search traffic
  • Filter conversations
  • Extract packet captures
  • Analyze application behavior
  • Investigate historical issues
  • Validate root cause

This allows IT teams to move from slow forensic workflows to near real-time operational troubleshooting.

Faster access to packet analysis means:

  • Faster remediation
  • Faster incident response
  • Faster validation
  • Faster escalation resolution
  • Reduced downtime

For operational teams, this speed advantage becomes a major differentiator.

Simplicity and Cost Efficiency Matter

Many legacy packet capture environments are difficult and expensive to scale.

Organizations often struggle with:

  • Hardware costs
  • Operational complexity
  • Fragmented visibility
  • Difficult management workflows
  • Large infrastructure requirements

Modern network packet capture tools are becoming significantly more flexible.

Virtualized deployments, centralized management, lightweight architectures, and simplified operational workflows now allow organizations to extend packet-level visibility across:

  • Branch offices
  • Remote locations
  • Data centers
  • Cloud environments
  • Hybrid infrastructures
  • Distributed enterprise networks

This makes packet-based observability far more accessible as a tool for modern IT operations teams.

Organizations no longer need to sacrifice cost efficiency or operational simplicity to gain powerful packet-level visibility.

Historical Packet Analysis Changes Operations

One of the biggest advantages of full packet capture is the ability to investigate issues long after they occur.

Most operational incidents are not caught live.

By the time troubleshooting begins:

  • The issue may have disappeared
  • Traffic conditions may have changed
  • Logs may be incomplete
  • Metrics may no longer reflect the problem

Historical packet analysis changes this entirely.

Teams can:

  • Go back in time
  • Reconstruct events
  • Analyze historical traffic
  • Validate timelines
  • Extract packet captures
  • Replay traffic using original timestamps
  • Investigate intermittent issues
  • Support network forensics investigations

Packet replay capabilities are especially valuable for:

  • Intermittent application slowdowns
  • VoIP quality degradation
  • Security investigations
  • Cloud troubleshooting
  • WAN analysis
  • Incident reconstruction

Real-World Operational Use Cases

VoIP & Unified Communications Troubleshooting

Packet analysis helps organizations quickly identify:

  • Jitter
  • Latency
  • Packet loss
  • RTP quality issues
  • SIP signaling problems
  • Call degradation


Cloud & Hybrid Environment Visibility

Packet-level visibility in the cloud helps organizations troubleshoot:

  • SaaS performance issues
  • Hybrid application latency
  • Encrypted traffic
  • WAN congestion
  • Remote user experience


Network Forensics & Incident Investigation

Historical packet analysis and packet forensics capabilities allow teams to reconstruct incidents and validate timelines using actual network evidence.


Distributed Environment Troubleshooting

Packet synchronization across distributed environments helps organizations quickly determine whether degradation originates at:

  • The client
  • The WAN
  • The cloud
  • The application
  • Remote locations

Packet-Based Observability & AiOps

As organizations explore AIOps initiatives, the quality, depth, and accuracy of operational data become increasingly important. AI-driven operations cannot rely on assumptions alone. They need trusted operational evidence, clear context, and visibility into what is actually happening across the environment.

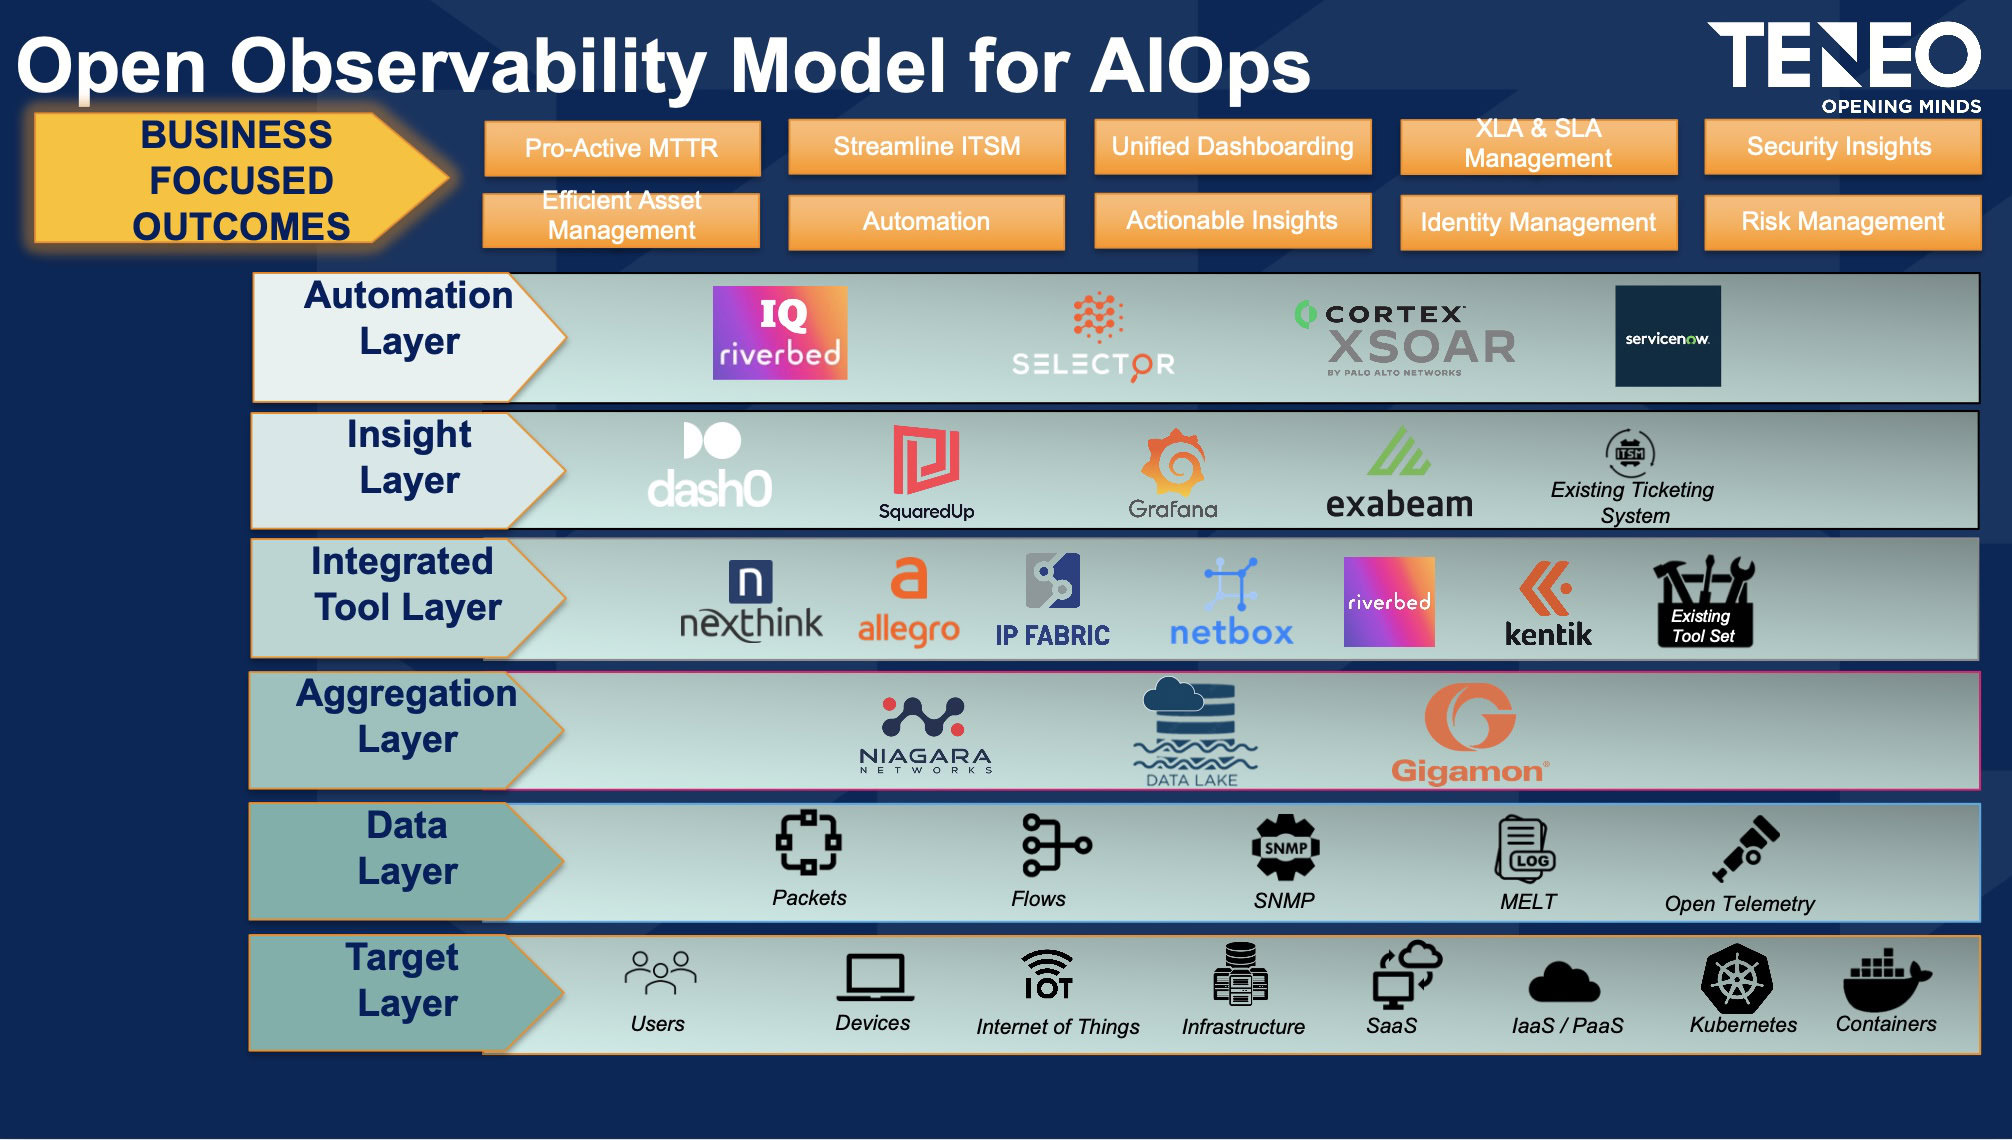
This is where Teneo’s Network Performance Monitoring & Diagnostics solution, powered by Allegro Packets, plays an important role in Teneo’s Open Observability Model for AIOps.  

Within the model, Allegro sits in the Integrated Tool Layer, helping organizations bring packet-level visibility into a broader observability ecosystem that also includes data sources, aggregation, insight, automation, and business-focused outcomes. By adding full-fidelity packet analysis to the observability stack, organizations can strengthen the foundation needed for AI-assisted troubleshooting, automated root cause analysis, anomaly detection, and faster remediation workflows.

Instead of relying only on summarized telemetry, AI-assisted workflows can use packet-based analysis to validate behavior and accelerate investigations with more complete operational evidence. This helps network and IT teams move from reactive troubleshooting toward smarter, more automated operations.

Packet-based observability is not just another monitoring capability. It is a key setup on the journey to leveraging the power of AI and automation to maximize network efficiency, reduce manual effort, and improve operational resilience.

Why Teneo

Technology alone does not solve operational complexity.

Teneo helps organizations operationalize Network Performance Monitoring & Diagnostics capabilities to improve visibility, accelerate troubleshooting, and strengthen operational resilience across modern enterprise environments.

Our team combines expertise across:

  • Networking
  • Observability
  • Packet analysis
  • Operational transformation
  • Hybrid infrastructure
  • Cloud visibility
  • Unified communications
  • AiOps strategy

Teneo’s NPMD solution, powered by Allegro Packets, helps organizations simplify troubleshooting while gaining the packet-level visibility needed to support modern operations.

As part of Teneo’s broader Open Observability Model for AIOps and StreamlineX framework, NPMD helps organizations build a stronger foundation for packet-based observability, operational resilience, AI-assisted operations, and future automation initiatives.

Final Thoughts

Modern enterprise environments require more than alerts and summarized telemetry.

When troubleshooting critical performance issues, organizations need operational evidence.

Packet-based visibility helps IT teams move beyond symptom chasing and uncover root cause through:

  • Packet capture
  • Packet analysis
  • Historical packet analysis
  • Deep packet inspection
  • Packet replay
  • Network traffic analysis
  • Packet forensics
  • Real-time packet analysis

By accelerating root cause analysis and improving operational visibility, organizations can reduce downtime, improve user experience, strengthen operational resilience, and simplify troubleshooting across distributed environments.

The organizations that can identify root cause fastest are the organizations best positioned to support modern digital operations.

Teneo NPMD powered by Allegro is a critical part of that journey. By closing the root cause gap and strengthening the integrated tool layer within Teneo’s Open Observability Model for AIOps, it helps organizations create the visibility, context, and confidence needed to leverage AI and automation more effectively across the network.

Cookie Policy
Teneo Logo

This website uses cookies so we can provide you with the best user experience possible.

Cookies are small files containing information that enables a website to recognise you. They’re downloaded to the device you use when you visit a website and sent back to that website each time you re-visit, or sent to another website that recognises the same cookie.

Our cookie policy tells you how and why we use cookies, and how this allows us to improve your online experience. You can read our full Cookie Policy here.

Strictly Necessary Cookies

Strictly necessary cookies include session cookies and persistent cookies. Session cookies keep track of your current visit and how you navigate the site. They only last for the duration of your visit and are deleted from your device when you close your Internet browser. Persistent cookies last after you’ve closed your Internet browser and enable our website to recognise you as a repeat visitor and remember your actions and preferences when you return.

Third Party Cookies

Third party cookies include performance cookies and targeting cookies. Performance cookies collect information about how you use a website, e.g. which pages you go to most often, and if you get error messages from web pages. These cookies don’t collect information that identifies you personally as a visitor, although they might collect the IP address of the device you use to access the site. Targeting cookies collect information about your browsing habits. They are usually placed by advertising networks such as Google. The cookies remember that you have visited a website and this information is shared with other organisations such as media publishers.

Keeping these cookies enabled helps us to improve our website and display content that is more relevant to you and your interests across the Google content network.